Lêer:European Output of Books 500–1800.png

Page contents not supported in other languages.
Vanuit Wiktionary, die vrye woordeboek.

Oorspronklike lêer(1 436 × 953 piksels, lêergrootte: 64 KG, MIME-tipe: image/png)

Hierdie lêer kom vanaf Wikimedia Commons en kan ook in ander projekte gebruik word. Die beskrywing op die lêer se inligtingsblad word hieronder weergegee.

Opsomming

Beskrywing
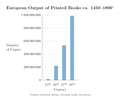
Deutsch: Geschätzte europäische Buchproduktion von 500 bis 1800. Bei den Manuskripten sind einzelne Urkunden und Chartas nicht berücksichtigt. Ein gedrucktes Buch ist definiert als ein Druckwerk von mehr als 49 Seiten.
English: Estimated European output of books from 500 to 1800. Manuscripts do not include individual deeds and charters. A printed book is defined as printed matter containing more than 49 pages.
Datum
Bron

Eie werk

Data from: Buringh, Eltjo; van Zanden, Jan Luiten: "Charting the “Rise of the West”: Manuscripts and Printed Books in Europe, A Long-Term Perspective from the Sixth through Eighteenth Centuries", The Journal of Economic History, Vol. 69, No. 2 (2009), pp. 409–445 (416–417, tables 1&2)
Outeur Tentotwo
Ander weergawes
This graph image could be re-created using vector graphics as an SVG file. This has several advantages; see Commons:Media for cleanup for more information. If an SVG form of this image is available, please upload it and afterwards replace this template with {{vector version available|new image name}}.


It is recommended to name the SVG file “European Output of Books 500–1800.svg”—then the template Vector version available (or Vva) does not need the new image name parameter.

LaTeX source

\documentclass[border=5mm]{standalone}
\usepackage{pgfplots}
\usepackage[super]{nth}
\usepackage{amsmath}
 
 
\pgfplotstableread{
Siglos Manuscritos Libros impresos
6       13552           nan
7       10639           nan
8       43702           nan
9       201742  nan
10      135637  nan
11      212030  nan
12      768721  nan
13      1761951 nan
14      2746951 nan
%15   4999161 12589000
16       nan            217444000
17      nan             531941000
18      nan             983874000
}\datatable
 
\definecolor{RYB1}{RGB}{128, 177, 211}
\definecolor{RYB2}{RGB}{253, 180, 98}
 
\begin{document}
\begin{tikzpicture}
\begin{semilogyaxis}[
        axis on top=false, grid=both, xmajorgrids=false, every minor grid/.style=gray!20,
        axis lines*=left,
        width=12cm, height=8cm, enlarge x limits=0.05,
        ymin=1000, ymax=1e9,ytick={1000,1e4, 1e5, 1e6, 1e7, 1e8, 1e9},
        yticklabels={1000, 10\,000, 100\,000, 1\,000\,000, 10\,000\,000, 100\,000\,000, 1\,000\,000\,000},
        enlarge y limits=false,
        ybar=-10pt, xtick={6,...,18}, xticklabel={\pgfmathparse{int(\tick)}\nth{\pgfmathresult}},
        xlabel=Siglos, xlabel style={yshift=-1ex},ylabel=Número\\ de Copias,
        ylabel style={rotate=-90, align=left, anchor=east, xshift=-4ex, name=ylabel},
        after end axis/.code={
                \node [
                        font=\large\bfseries,
                        text=RYB2!60!black, fill=white, fill opacity=0.85, text opacity=1,
                        anchor=center, inner xsep=1pt]  at (axis cs:11,5e3) {Manuscritos};
                \node [
                        font=\large\bfseries, inner xsep=1pt,
                        text=RYB1!60!black,
                        fill=white, fill opacity=0.85, text opacity=1,
                        align=center, anchor=center]  at (axis cs:16.6,5e3) {Libros impresos};\
        },
        title={Producción Europea occidental de libros entre los años 500 y 1800$^{\text{\tiny{*}}}$},
        title style={font=\large\bfseries, align=center}
        ]
 
        \addplot +[fill=RYB1, draw=RYB1!50!black] table [y=Books] {\datatable};
        \addplot +[fill=RYB1, draw=RYB1!50!black, /pgf/bar shift=2.5pt] coordinates {(15,12589000)};
        \addplot +[fill=RYB2, draw=RYB2!50!black] table {\datatable};
        \addplot +[fill=RYB2, draw=RYB2!50!black, /pgf/bar shift=-2.5pt] coordinates {(15,4999161)};
        \draw (rel axis cs:0,0) -- (rel axis cs:1,0);                 
\end{semilogyaxis}
\node (annotation) at (current axis.below south west) [inner xsep=0pt, anchor=north west, align=left, font=\tiny] {$^*$without Southeast Europe (Byzantine, later Ottoman realm) and Russia};
 
\end{tikzpicture}
\end{document}

Lisensiëring

Ek, die outeursreghouer van hierdie werk, publiseer dit onder die volgende lisensie:
w:af:Creative Commons
naamsvermelding insgelyks
Hierdie lêer is gelisensieer onder die Creative Commons Erkenning-Insgelyks Deel 3.0 Onoorgedraagde lisensie.
U is vry:
  • om te deel – die werk kopieer, versprei en deurgee
  • om te hermeng – om die werk aan te pas
Onder die volgende voorwaardes:
  • naamsvermelding – U moet die nodige krediet gee, 'n skakel na die lisensie verskaf en aandui of daar veranderinge aangebring is. U mag dit op enige redelike manier doen, maar nie op enige manier wat daarop dui dat die lisensiegewer u of u gebruik onderskryf nie.
  • insgelyks – As u die materiaal hermix, transformeer of voortbou, moet u u bydraes versprei onder die dieselfde of versoenbare lisensie as die oorspronklike.

Captions

Add a one-line explanation of what this file represents

Items portrayed in this file

uitbeelding

Lêergeskiedenis

Klik op die datum/tyd om te sien hoe die lêer destyds gelyk het.

Datum/TydDuimnaelDimensiesGebruikerOpmerking
huidig02:41, 22 Desember 2011Duimnaelskets vir weergawe vanaf 02:41, 22 Desember 20111 436 × 953 (64 KG)TentotwoRemoved source text from image
03:53, 16 Desember 2011Duimnaelskets vir weergawe vanaf 03:53, 16 Desember 20111 455 × 953 (73 KG)TentotwoImproved formatting
00:38, 15 Desember 2011Duimnaelskets vir weergawe vanaf 00:38, 15 Desember 20111 260 × 799 (87 KG)Tentotwo

Daar is geen bladsye wat dié lêer gebruik nie.

Globale lêergebruik

Die volgende ander wiki's gebruik hierdie lêer: